Healthy with Jodi

BMI, BF%, Waist to Hip Ratio for Males &Females

    BMI, BF%, Waist to Hip Ratio, Genders

    Ever wonder where you “should” be?  Here are some good guidelines for you to follow.  If you are looking to get “healthy”, whatever that means to you, I can help you with your starting measurements and design you an individual program based on your goals.

    BMI Classification

    Less than 18.5    Underweight
    18.5 to 24.9         Normal
    25 to 29.9            Overweight
    30 to 34.9            Obese
    35 to 39.9            Severe Obesity
    40 to 44.9           Morbid Obesity
    45 & up                Super Obesity
    Waist Circumference

    Increased Risk for Obesity Related Disease
    Male Greater Than 37 inches
    Female Greater Than 31.5 inches

    Substantially Increased Risk for Obesity Related Disease
    Male Greater Than 40.2 inches
    Female Greater Than 34.6 inches

    Extremely High Risk for Obesity Related Disease
    Male Greater Than 47.2 inches
    Female Greater Than 43.3 inches
    Waist to Hip Ratio

    Classification              Male                          Female

    Excellent                      Less than                  0.85 Less than 0.75
    Good                             0.85-0.90                 0.75-0.80
    Average                        0.90-0.95                 0.80-0.85
    Overweight                  0.95-1.00                  0.85-.090
    Obese                            Greater than 1.00   Greater than 0.90
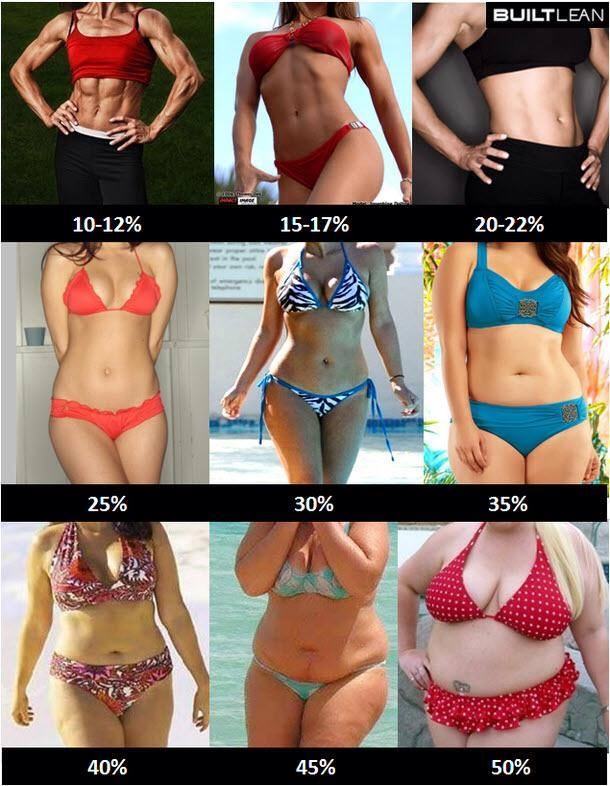
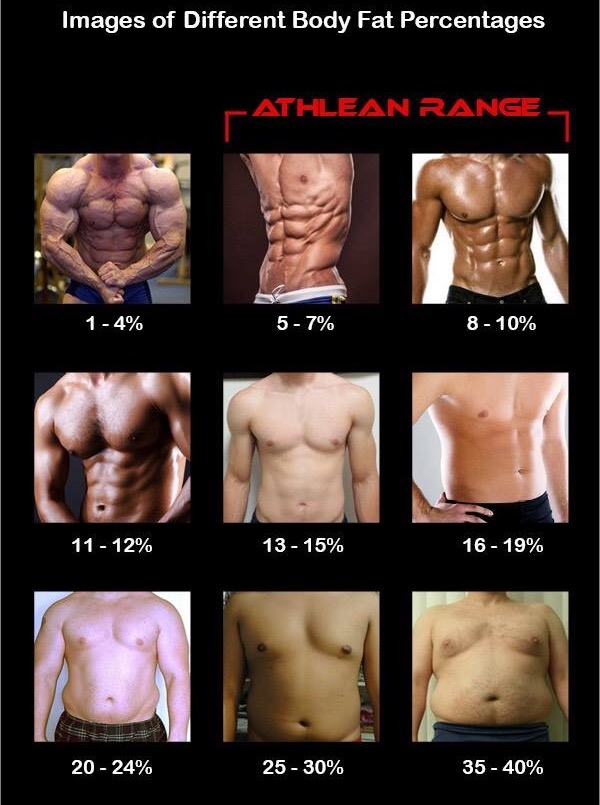
    Body Fat %
    Classification                              Male             Female

    Minimum Essential Fat %       2-4%            10-12%
    Athletes                                       4-13%           12-20%
    Fitness                                         13-17%         20-24%
    Acceptable                                   17-25%        24-31%
    Obese                                            25% & Up   32% & Up

    Obesity Facts

      Food for thought as you prepare for the super bowl today? The alarming rates of Obesity need to published and talked about.  Everyone wants to “live in the moment” But we are stealing precious moments due to our repeated poor food choices.  If you want to be around to outlive your kids, and you want to be the fun mom or fun grandparent that can keep up with the kids we need to educate ourselves and start making better choices to make that happen.

      You can do it.  We can do it, and I can help!

      Obesity facts:

      Today, about 75% of US men and 67% of US women are either overweight or obese. Between 1988 and 1994, 63% of men and 55% of US women were overweight or obese.

The NHANES says that about 35% of men and 37% of women are obese, 40% of men and 30% of women are overweight. 2/3 of US adults are at a unhealthy weight.

      US Centers for Disease Control and Prevention (CDC) shows that Americans have been gaining weight since the 1960’s. The average US woman weighs about 166 pounds compared to 140 in 1960. 166 was the average for a man in 1960.
      Our children are not expected to outlive us. Obesity is one of the biggest contributors to this shortened life expectancy, it is the root of a lot of chronic health conditions.

      Our environment contributes in some of the following ways:
      Overuse of antibiotics in food production and medicine
      Growth-enhancing drugs used in food animals
      Endocrine-disrupting chemicals and pesticides
      Social media centered around junk food and artificial sweeteners.
      Highly processed genetically modified (GM) foods are full of ingredients that contribute to metabolic dysfunction and weight gain/obesity.

      The McKinsey Global Institute says the annual global cost of obesity is now $2 trillion. (For comparison, alcoholism costs are $1.4 trillion annually, road accidents cost $700 billion, and unsafe sex costs $300 billion)  The McKinsey report estimates that nearly 1/2 of the world’s adult population will be overweight or obese by 2030.

      In the US, 8 obesity related diseases account for 75% of healthcare costs. These include type 2 diabetes, heart disease, dementia, cancer, Polycystic ovarian syndrome, hypertension, lipid problems, NAFLD (nonalcoholic fatty liver disease).

      The National Health Expenditure Accounts (NHEA) are the official estimates of total health care spending in the US. In 1960, the NHEA measures annual U.S. expenditures for health care goods and services, public health activities, government administration, the net cost of health insurance, and investment related to health care.
      U.S. health care spending in 2014 reached $3.0 trillion or $9,523 per person.
      The nation’s Gross Domestic Product accounted for 17.5% of health care costs.

      cms.gov/research-statistics-data-and-systems/statistics-trends-and-reports/nationalhealthexpenddata/nationalhealthaccountshistorical.html
      http://www.medicinenet.com/script/main/art.asp?articlekey=189100
      http://www.surgeongeneral.gov/library/calls/
      http://articles.mercola.com/sites/articles/archive/2015/07/08/increasing-us-adult-weight.aspx
      http://www.medicinenet.com/script/main/art.asp?articlekey=189100
      http://atlanta.cbslocal.com/2015/06/15/cdc-average-american-woman-now-weighs-as-much-as-1960s-us-man/
      http://archinte.jamanetwork.com/article.aspx?articleid=2323411